Safe and foresighted in the driver seat with the Caminada Dashboard


Contact
Öffnungszeiten:
Monday to Friday
08.00 - 12.00 h / 13.00 - 17.00 hFernsupport durch Caminada:
With the dashboard, you get a management tool that is practical to use. We have therefore emphasized the following success factors:
You can access your dashboard at any time using your personal link. This is structured in a way that it can be quickly implemented in standardized accounting. The accounting department's available bookings are read directly into PowerBI as source data and can thus be retrieved. The degree of automation can be adapted to individual needs.
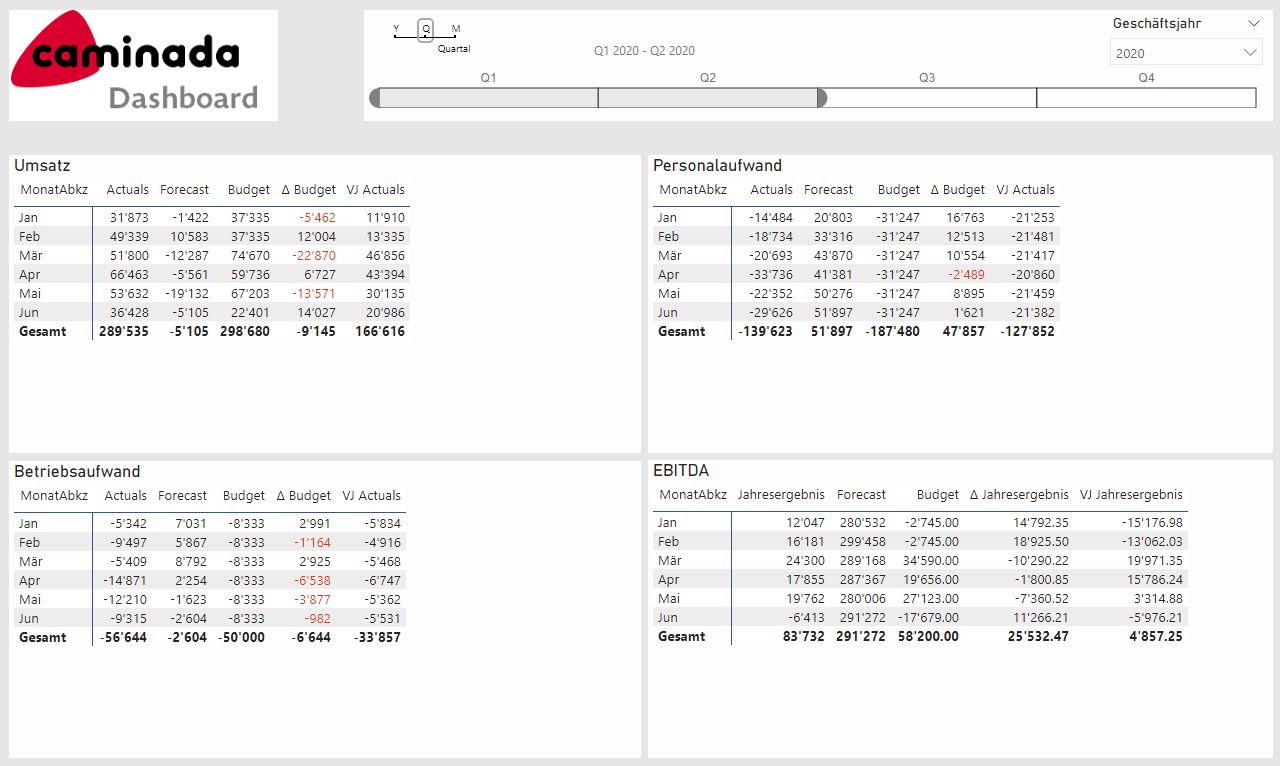
Our experience shows that a dashboard is only used effectively if it focuses on a few but crucial parameters and does not get lost in detail. The most important key figures for this are:
The figures and graphics are presented in a user-friendly way and even allow company-specific coloring to a certain extent.
To ensure that the solution can be implemented in an uncomplicated manner and that the costs are kept within reasonable limits, we offer a standard solution in the above-mentioned key figures' scope. According to customer statements and our experience, this solution fully meets the requirements of the company management. When choosing the underlying technical platforms (Abacus and Power BI), we made sure that the system is dynamic and, thus also future-proof. If the need for new or additional KPIs or key performance indicators arises, these can be integrated at any time on a customer-specific basis. This can be done in the area of financial data. Still, it is equally possible for longer-term integration and analysis of adjacent business areas such as CRM, HR, or trading systems. The Caminada Dashboard is ideal for small and larger companies, be it for local, national, or international applications.
Of course, a dashboard always raises questions about data security and authorization of those authorized to view data. How can we ensure that a person sees what they are allowed to see? Our experience shows that Power BI is a perfect solution because it is possible to specify precisely who sees which analyses and graphics. You decide whether the source data should be stored centrally on your system or on ours regarding data storage.
Feedback from customers and our own experience have confirmed that the "Caminada Dashboard" is a very valuable management tool. Quick and easy to understand, you get an insightful overview of your company's financial data and KPIs in just a few minutes, see current developments, and can derive alternative courses of action.
You can find more information about the Caminada Dashboard here. Would you like a first insight? Then please contact us. We will be happy to show you the application in a demo at any time. This can be in an online meeting or in a personal conversation.